JDotter How-to Documentation
Java-Dotter (JDotter) is a platform-independent Java interactive interface for the Linux version of Dotter – a widely used program for generating dotplots of large DNA or protein sequences. JDotter runs as a client-server application and can send new sequences to the Dotter program for alignment as well as rapidly access a repository of preprocessed dotplots. JDotter also interfaces with a sequence database or file system to display supplementary feature data. Thus, JDotter greatly simplifies access to dotplot data in laboratories that deal with large numbers of genomes and have a multi-platform organization.

How to open a dot plot from the VOCS database
From the main JDotter window, select the File menu item. Choose Open Remote Plot…. This will bring up a dialog box with two lists of names, representing the available whole-genome sequences in the VOCS database. Select one sequence to display on the horizontal axis and one to display on the vertical axis. The drop-down menus above the list allow you to switch to a different viral family database and change between name or abbreviation viewing preferences. After you have made your selections, click Open to send the request to the server. Once the dot plot has been retrieved, the Dot Plot Window will open with the selection displayed.
Back
How to send a list of sequences to be plotted
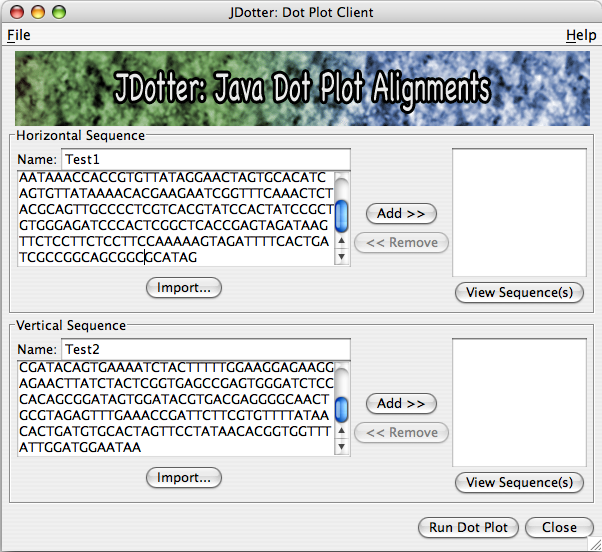
To build a list of sequences to send to the application server to be processed, you may add them one by one into the list by entering a name and a sequence and clicking Add >>.
When you click Add >> to add a sequence, the fields will be cleared and the sequence name will be added to the list of sequences to run. You may remove names by selecting them from the list and clicking << Remove.
Back
How to load sequences from a file
In addition to adding sequences one at a time, you can import one or more sequences from a FASTA file. Click Import… in the relevant sequence panel (horizontal or vertical.) A file dialog will pop up allowing you to select a file from one of your local folders. The sequence(s) will be loaded directly into the list just as though you had added them one by one into the entry fields provided.
If the import is successful, this dialog will pop up to let you know the sequences have been added. (No message will appear for an unsuccessful import.)
Back
How to select a region and zoom in to it
- Click once with the middle mouse button and drag the red box to the size and shape you want, then double-click (again with the middle button.)
- (Mac users) Hold down either ALT or the Apple key; click with the left mouse button, drag the box to cover the region, then release the left mouse button.
To zoom in to this region, select Zoom Selection from the View menu.
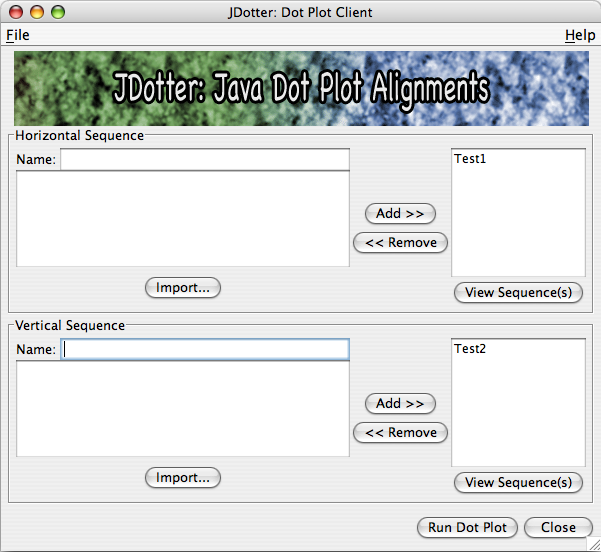
How to view your submission
From the main JDotter window, click on View Sequences (beneath the horizontal or vertical sequence list.) This will open the sequence submission window.
From here you can view the sequences currently added for submission. You may also remove sequences by selecting them in the list and clicking Remove, or remove all sequences to clear the list by clicking Remove All. Click Close to return to the main JDotter window.
Back
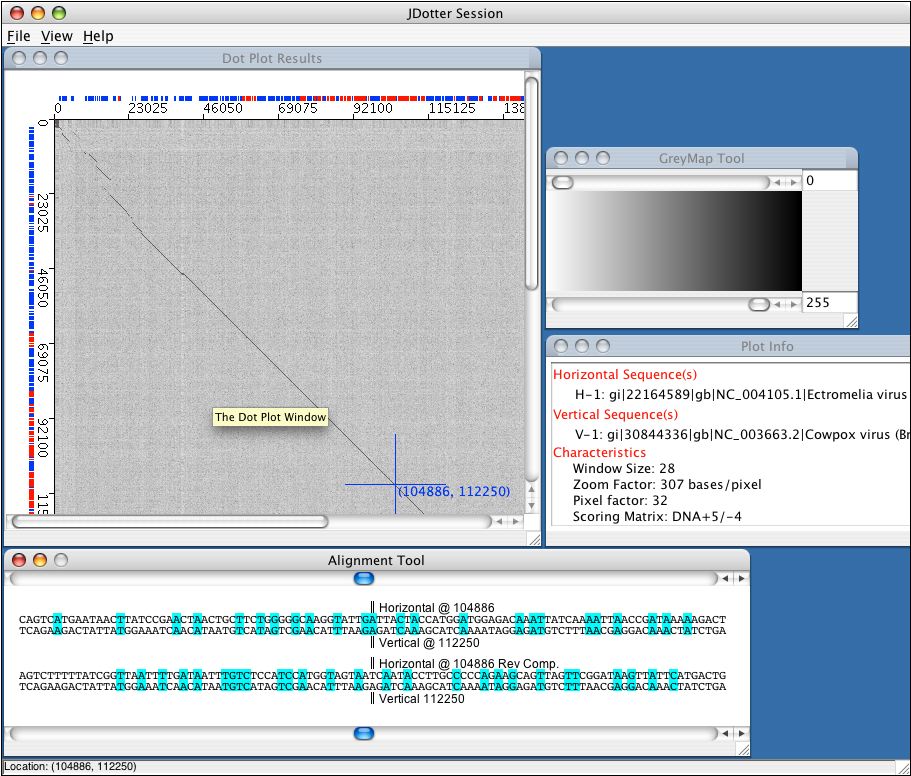
How to navigate the dot plot
Left-click on a position in the dot plot to move the crosshairs to that point. The sequence positions represented by the crosshairs are displayed offset from the crosshairs themselves. (These coordinates represent the sequence positions on the displayed map, not the pixel coordinates on the screen.)
You can also use the keyboard to navigate as follows:
| Key | Movement |
|---|---|
| Left Arrow | Move Left |
| Right Arrow | Move Right |
| Up Arrow | Move Up |
| Down Arrow | Move Down |
| > or . | Move Down & Right |
| < or , | Move Up & Left |
| { or [ | Move Down & Left |
| } or ] | Move Up & Right |
How to move to/zoom in to a specific region from the menu
To zoom to a specific region in the same way, select Zoom To… from the View menu and enter the specific beginning and ending coordinates on the x and y axes of the region that you would like to zoom into. (These coordinates represent the sequence positions on the displayed map, not the pixel coordinates on the screen.)
How to zoom to the original view of the dot plot
To zoom back out to the original view of the data, select Zoom Original from the View menu. This will reload the original dot plot.
Back
How to use the sequence alignment tool
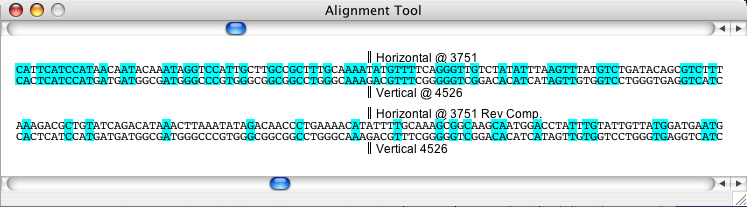
If the dot plot represents a DNA-DNA matrix, the horizontal strand will be compared to the vertical in both forward and reverse complement ordering. For proteins, exact character matches are coloured with a light cyan while positive non-matching hits are coloured in a deeper blue.
To move the alignment tool view, drag the scrollbars displayed above and below in the tool. The top scrollbar represents the location along the horizontal axis, while the bottom scrollbar represents the location along the vertical axis. You will notice that as the scrollbar positions are changed, the crosshairs in the Dot Plot Window also move, and visa versa. To move along the alignment currently in the window (in other words, to move along the diagonal) use the < and > buttons.
How to view local Dotter (.dot) files in JDotter
How to guide to viewing Dotter files in JDotter.
The adjectives big-endian and little-endian refer to which bytes are most significant in multi-byte data types and describe the order in which a sequence of bytes is stored in a computer’s memory.
In a big-endian system, the most significant value in the sequence is stored at the lowest storage address (i.e., first). In a little-endian system, the least significant value in the sequence is stored first.
Many mainframe computers, particularly IBM mainframes, use a big-endian architecture. Most modern computers, including PCs, use the little-endian system. The PowerPC system is bi-endian because it can understand both systems.
Converting data between the two systems is sometimes referred to as the NUXI problem. Imagine the word UNIX stored in two 2-byte words. In a Big-Endian systems, it would be stored as UNIX. In a little-endian system, it would be stored as NUXI.
Opening Dotter (.dot) files in JDotter:
1) Select File/Preference/User Interface/ in the main JDotter window.
2) In the JDotter Preferences window that opens, choose either the Little-Endian or Big-Endian radio button depending on how your file was created.
3) Click the “Apply” button to apply changes
4) Select File/Open Local Plot…/Dotter (.dot)/ in the main JDotter window.
5) Enter the Horizontal, Vertical, and Dot Plot files in the respective boxes
6) Click the “Run Dot Plot” button to view the plot (Note: If you get an error, it could mean that your file was created under a different architecture. Go back to step 2 and switch the .dot file type)