VGO Documentation
Getting to know VGO
A brief introduction to the use of VGO and its main windows.
Introduction
Introduction
VGO is a Java-based interface for viewing and searching genomes. It can be used to display information about a genome, including its genes, ORFs, and start/stop codons. It can also be used to perform regular expression, fuzzy motif, LCS, and masslist searches.
VGO allows the user to identify related genes in multiple sequences. It also allows one to see how their search results compare to the identified genes, ORFs, and start/stop codons.
Sequence Listing Window
The components of the sequence listing window.
The sequence listing window is the first window that you see when you start VGO. You add the list of sequences that you want to view to this window.
The sequence listing window consists of three parts:
- The menu bar
- The toolbar
- The list of sequences that have been loaded into VGO
The Menu Bar
The items in the Menu Bar can be used for loading sequences into VGO, removing sequences from the list, viewing sequences, opening related websites in a web browser, and closing VGO.
The Toolbar
The toolbar contains buttons for performing the most common actions (also available from the File and View Menus).

In order from left to right, here is what the toolbar buttons do:
- Loads a sequence from the currently selected VOCs database.
- Displays some brief information about the currently selected sequence.
- Displays the currently selected sequence(s) in a new sequence display window
- Displays the nucleotide sequence for the top strand of the currently selected sequence.
- Displays the nucleotide sequence for the bottom strand of the currently selected sequence.
- Displays a portion of the nucleotide sequence for the currently selected sequence.
Sequence List
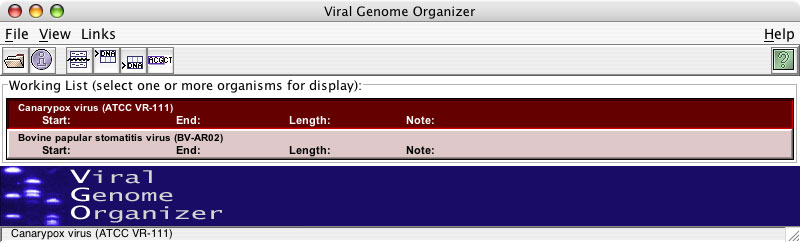
The sequences that have been loaded into VGO are displayed here in a list as red and pink boxes. Selected sequences in the list are shown as red boxes; sequences in pink boxes have not yet been selected. Note that you can select multiple sequences from the list.
Sequence Listing Window Menu Bar
Features and functions of the menu bar for the Sequence Listing window of VGO.
The File Menu
“Open”: Enables you to open genomes directly from the VOCs Database (VOCs DB), or from Fasta, Genbank, or Base By Base (BBB) formated files.
“Choose Database”: Allows you to choose which database VGO is to work from.
“Preferences”:
- Viewing Options: Opens the View Settings window.
- External Application Preferences – Allows you to set preferences for Blast, MView, JDotter, ClustalW and TCoffee.
“Close Selected Sequences”: Removes selected sequences from the Sequence Listing window.
“Close All Sequences”: Removes all sequences from the Sequence Listing window.
The View Menu:
“Virus Info”: Opens additional details for each virus. 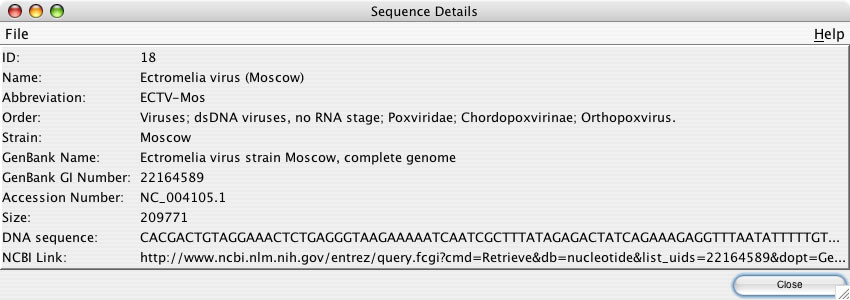
“Sequence Map”: Opens the Sequence Display window.
“Genome Subsequence”: Displays a specified section of the nucleotide sequence, as well as its complementary amino acid sequence.
“Top Strand DNA”: Displays the top strand nucleotide sequence for the entire genome in the sequence viewer window (See Top / Bottom Strand DNA).
“Bottom Strand DNA”: Displays the bottom strand nucleotide sequence for the entire genome in the sequence viewer window (See Top / Bottom Strand DNA).
“View Dot Plot”: Opens Complete Genomes, or Selected Regions in JDotter.
“Framed Translation”: 6 frame amino acid translation of the selected sequence, no more than 10kb in length.
The Links Menu:
“Manage Bookmarks” Allows you to customize URLs for VGO to open in a web browser.
The Help Menu:
“VGO Online Help” allows users to access online documentation for VGO.
Sequence Display Window
The components of the sequence display window.
The sequence display window consists of four parts:
- The menu bar
- The toolbar
- The displayed sequences
- The display controls
The Menu Bar
The menu bar contains tools for searching the sequences, analyzing the sequences, viewing information about the sequences, and opening related websites.
The Toolbar
The toolbar contains buttons for performing the most common actions.
![]()
In order from left to right, here is what the toolbar buttons do:
- Loads a sequence from the currently selected VOCs database into the sequence display window.
- Displays some brief information about the currently selected sequence.
- Performs a regular expression search of the sequence.
- Displays a user-defined portion of the sequence.
- Displays the top strand nucleotide sequence.
- Displays the bottom strand nucleotide sequence.
- Loads a sequence analysis from a user-supplied file into VGO.
Displayed Sequences
The sequence display provides a visual overview of the selected sequences.
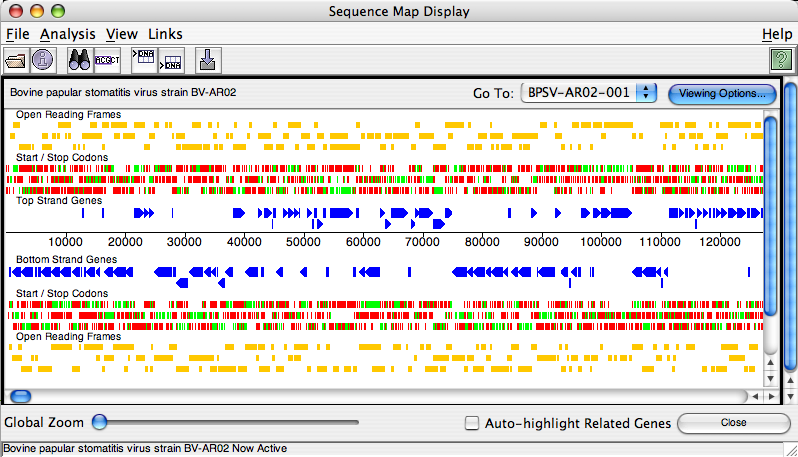
In the top left corner of the sequence display, the name of the displayed sequence is shown. The top right corner contains a drop down gene list (clicking on a gene will jump the display to that gene), and a button that will open the viewing settings window
The main part of the sequence display can contain several different types of graphically displayed information:
- Sequence Scale (always displayed)
- Identified Genes (always displayed) – shown as blue arrows
- Start and Stop Codons – displayed as green and red boxes (respectively)
- Open Reading Frames – displayed as yellow boxes; user can specify minimum required ORF length.
- Bottom Strand Features (ORFs, start/stop codons, etc.)
- Gene Names (labels shown beside their respective genes)
- Lane Descriptions (each row in the display labelled)
- GFS Matches – displayed as teal boxes, with the best match displayed as a purple box
- Repeat Regions (e.g. poxvirus ITRs) – displayed as orange boxes
- BBB Comments/Primers (only applicable if genome has been BBB-annotated)
- Regular Expressions Matches/Fuzzy Motif Matches – displayed as black boxes (only applicable if these searches have been performed)
These are displayed at different distances from the sequence scale, so they do not overlap. By opening the Viewing Settings window, the user can select what information to display.
Clicking on some of the items that are displayed will select them; double-clicking will bring up more detailed information about the item. You can select a region of the genome by clicking at the beginning of the region, dragging the mouse over to the end of the region, and releasing the mouse button.
Display Controls
In the bottom of the VGO window, there are some display controls.
![]()
The Global Zoom control can be used to zoom in and out of the sequences. To zoom in, just drag the slider over to the right; to zoom out, drag it to the left. Selecting the Auto-highlight Related Genes will cause related genes in all displayed sequences to be highlighted when a gene is selected. The Close button is used to close the sequence display window. The name of the currently selected sequence is displayed in the bottom edge of the window.
Sequence Display Menu Bar
The File Menu
“Add Organism(s)” Allows users to add one or more organisms from the VOCs Database
“Close Organism” Removes selected organism from the current Sequence Map Display
“Exit Window” Closes Sequence Map Display window
The Analysis Menu
“Search All Sequences” Allows users to perform a Regular Expression or Fuzzy Motif Search (See Searching Sequences) of all sequences within the Sequence Map Display.
“Search Selected Sequence” Allows users to perform a Regular Expression or Fuzzy Motif Search (See Searching Sequences ) on selected sequences within the Sequcence Map Display.
“LCS Search” Allows users to search for the largest or minimum common subsequences between two or more genomes.
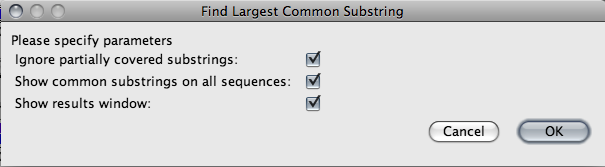
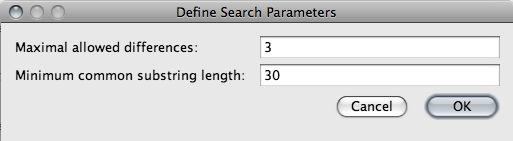
“DLCS Search” Allows users to search for the Longest Common Subsequences, with defined allowable differences, between two or more genomes.
“Gene Analysis” Allows user to analyze genomes base and amino acid composition, as well as family representation (see Gene Analysis).
“Display Graph” Displays specified base composition graph beneath genomes in the Sequence Map Display (See Display Graph).
“Import Analysis” Allows users to import and view external analysis of specified genomes (See Import Analysis)
The View Menu
“Genome Subsequence”: Displays a specified section of the nucleotide sequence, as well as its complementary amino acid sequence.
“Virus Info”: Opens additional details for each virus.
“Top Strand DNA”: Displays the top strand nucleotide sequence for the entire genome in the sequence viewer window.
“Bottom Strand DNA”: Displays the bottom strand nucleotide sequence for the entire genome in the sequence viewer window.
“Framed Translation”: 6 frame amino acid comparison of the selected sequence, no more than 10kb in length.
The Links Menu:
“Manage Bookmarks” Allows you to customize URLs for VGO to open in a web browser.
The Help Menu:
“VGO Online Help” allows users to access online documentation for VGO.
Viewing Settings Window
The components of the viewing settings window
The viewing settings window is used to choose which items are displayed in the sequence display.
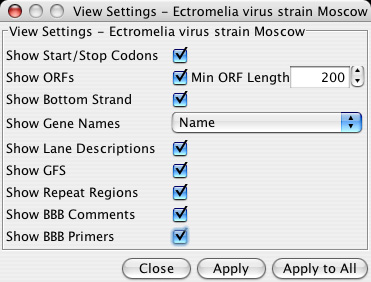
The following settings can be adjusted with this window:
- Show Start/Stop Codons – if checked, then the start and stop codons are displayed, otherwise they are not displayed
- Show ORFs – if checked, then the open reading frames will be displayed
- Min ORF Length – if Show ORFs is checked, then this is the minimum length that an ORF must be for it to be displayed
- Show Bottom Strand – if checked, then the bottom strand of the sequence is displayed. This only applies to sequences with a top and bottom strand.
- Show Gene Names – this will cause genes to be labelled with their names, when you are zoomed in enough to see the gene labels.
- Show Lane Descriptions – if checked, then the titles of the different sections of the sequence display are shown.
- Show GFS – if checked, then the GFS matches are displayed if a GFS search has already been performed.
- Show Repeat Regions – this shows large repeated regions (such as poxvirus ITRs).
- Show BBB Comments/Show BBB Primers – respectively, allow BBB comments and primers to be seen (only applicable for a BB-edited sequence).
The Close button will close the viewing settings window without applying your changes. The Apply button will only apply the settings to the selected sequence. The Apply to All button will apply the changes to all of the displayed sequences.
Loading Sequences
How to load sequences into VGO.
Framed Translation
How to view a 6 frame amino acid translation of the selected sequence.
The framed translation facility of VGO displays a 6 frame amino acid translation of a selected portion of sequence.
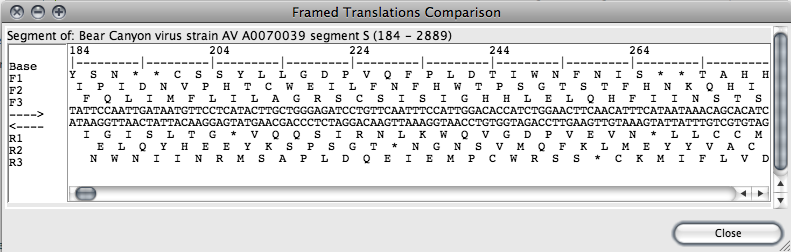
To get a framed translation for one or more sequence segments, select portions of one or more organisms (via the Sequence Map). Then, in the main window, select those organisms you wish to display, then choose “Framed Translation” from the “View” menu.
Note: The framed translator can handle selections of no more than 10kb in length. If a larger selection is attempted, a warning dialog box will be displayed.
The framed translation window displays each amino acid in single letter abbreviated format with stop codons marked with a “*”. The ruler along the top marks each 10 bases in the DNA sequence with a tick, and each 20 bases are marked with their position in the entire sequence for the organism being displayed.
The sequence displayed on the reverse side is the complement of that on the forward strand. Genes ocurring on the top are coded from left to right, and on the bottom from right to left.
Loading Sequences from a File
How to load sequences from Fasta, GenBank, or BBB wp-content/uploads/2018/12 into VGO.
From a Fasta File
To load sequences from a fasta file, go to the sequence listing window. Go to the File menu, choose Open, then choose Open from Fasta. Select the file that you want to load, and each sequence will be loaded.
Note: Fasta wp-content/uploads/2018/12 do not contain any annotations, only sequence data.
From a GenBank File
To load sequences from a GenBank file, go to the sequence listing window. Go to the File menu, choose Open, then choose Open from GenBank. Select the file that you want to load, and each sequence will be loaded, along with their annotations.
From a Base-by-Base File
To load sequences from a GenBank file, go to the sequence listing window. Go to the File menu, choose Open, then choose Open from BaseByBase. Select the file that you want to load, and each sequence will be loaded, along with any annotations that have previously been added to the file in Base by Base.
Loading Sequences from the VOCs Database
How to load sequences from the VOCs database into VGO.
To load sequences from the VOCs database into VGO, go to the sequence listing window. VGO can only load sequences from one database at a time; if the correct database is not currently open, select Choose Database from the File menu. The following dialog window will appear.
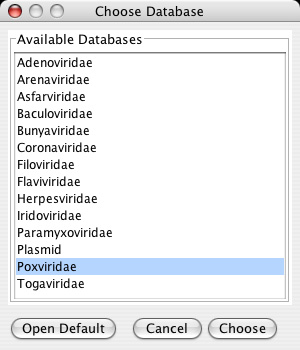
Select the database that you want, and click the Choose button.
Once you have the correct database selected, go to the File menu, choose Open, then choose Open from VOCs DB. The following dialog window will appear.
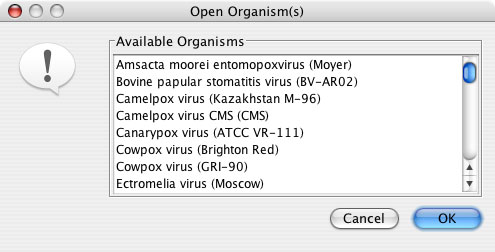
Choose the sequences that you want to load (multiple sequences can be selected by holding down the Apple key (Mac) or CTRL (PC)), then click on the OK button.
Sequence Analysis
How to use the sequence analysis tools in VGO.
Dispay Graph
How to display a graph of nucleotide composition.
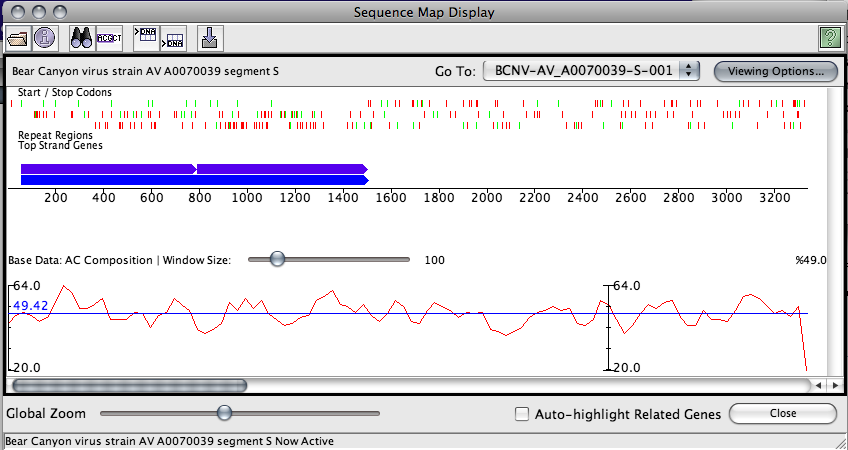
Currently, VGO is able to plot nucleotide composition, sampled at customizable rates, along the entire genome. To get this information, select “Display Graph” from the “Analysis” menu in the sequence map. The currently active panel will then display a graph of the percent composition of the bases chosen.
This graph panel will appear at the bottom of the sequence map and display the following information:
- A plot line in red. This plots the data long the sequence at the scale currently displayed in the map window
- A description of the data being plotted
- The sampling window size, which is customizable through the use of a slider
- The minimum percent composition along the entire genome (Y-axis minimum)
- The maximum percent composition along the entire genome (Y-axis maximum)
- The mean percent composition along the currently viewable portion of sequence. This is displayed in blue.
Graph calculations are done using a sliding window scale, sampled at regular fractions of the window size. By default, the fraction of the window size used to sample the data is 1/3. This means that with a window size of 60, data will be sampled every 20 bases. In addition, the information displayed at every 20th base will be the average from that position forward to the end of the window. For performance reasons, only the data currently displayed on the screen will be sampled. A side effect of this is that the the shape of the graph may appear to change as you scroll left or right through the map display.
Gene Analysis
How to use the gene analysis tools.
There are currently 3 properties that can be used to color-code genes on the sequence map in VGO. These properties are: Base Composition, Amino Acid Composition and Family Representation. When this menu item is selected, a dialog appears requesting parameters to display. Once these are set, VGO maps this data on the screen. To see a longer explanation of the parameters chosen and a range of values, double click on one of the resulting gene features.
- Base Composition
- This colors genes based on the percentage of one or more nucleotide bases that they contain.
- Amino Acid Composition
- This colors genes based on the percentage of one or more amino acids that they contain.
- Family Representation
- This maps the virus frequency of each gene in the displayed genome. This is to say, it maps based on the number of viruses represented in the particular gene’s family.
Import Analysis
How to import an analysis into VGO.
VGO allows for the import of analyses done externally.
Currently, this is done through the use of flat text wp-content/uploads/2018/12 which contain descriptions of specific regions of interest. This information includes the start position, the end position, the strand and a description of the regions. Any number of different analyses may be contained within a file, and any number of regions may be contained within an analysis.
To open a file, select “Import Analysis” from the “Analysis” menu on the sequence map window.
The file format is as follows:
    >Analysis 1 name
    start|stop|strand|description|color
    start|stop|strand|description|color
    ...
    >Analysis 2 name
    ...
    etc.
An Example:
   >First VGO Import Analysis Example
   100|400|POSITIVE|region 1|2F4F4F
   500|600|NEGATIVE|region 2|2E8B57
   >Second VGO Import Analysis Example
   400|500|POSITIVE|region 3|A52A2A
   600|700|NEGATIVE|region 4|A52A2A
This example would produce the following mapping in the VGO sequence map.
Regular Expression, Fuzzy Motif, and GFS Searches
Regular Expression Search
How to perform a regular expression search on a sequence.
You can do a regular expression search from the sequence display window; select Reg. Expression Search from the Analysis menu. The following dialog will then appear:
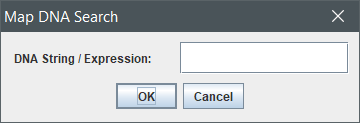
Enter your regular expression in the textbox, and click on the OK button to perform the search, or the Cancel button to close the dialog window without performing the search.
Regular expressions allow one to search for of precise patterns which may include optional sections and/or repeated sequences. For detailed help on regular expressions, please see The Perl Regular Expression page for more information.
Examples of Regular Expression Searching
| Regular Expression | What it matches |
|---|---|
| ACT | ACT |
| [ AC ]T | A or C followed by T |
| AC[ ^T ]ACT | AC followed by anything BUT a T followed by ACT |
| ACT* | AC followed by 0 or more T’s |
| (ACT)* | ACT repeated 0 or more times |
| (ACT)+ | ACT repeated 1 or more times |
| (ACT)? | ACT repeated 0 or 1 times |
| (ACT){n} | ACT repeated n times |
| (ACT){n,} | ACT repeated at least n times |
| (ACT){n,m} | ACT repeated at least n times but not more than m times |
| ((AC)[ TA ]){n} | AC followed by T or A – repeated n times |
Fuzzy Motif Search
How to do a fuzzy motif search on a sequence.
You can do a fuzzy motif search from the sequence display window Select Fuzzy Motif Search from the Analysis menu. The following dialog will then appear.
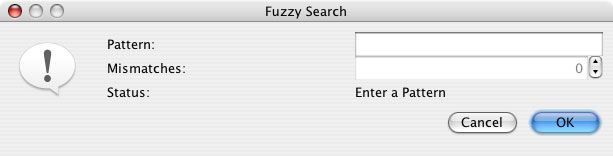
Enter your fuzzy motif in the top textbox and enter the number of mismatches to allow in the lower textbox. Click on the OK button to perform the search, or the Cancel button to close the dialog window without performing the search.
The Fuzzy Motif Search allows users to enter in an expression pattern (see below for an explanation of the pattern grammar used) as well as a maximum number of mismatches tolerated in a search hit. VGO then searches marked sequences for this motif and displays the list of hits by location along the sequence. In addition to the ambiguities created by mismatches, users may enter in IUB ambiguity codes, which are also indicated below.
Examples of Fuzzy Motif Searching
| Fuzzy Expression | What it matches |
|---|---|
| ACT | an A, C, T pattern |
| [ AC ]T | an A or a C followed by a T |
| {AC}T | Everything but an A or a C followed by a T |
Note: When counting mismatches, [] and {} count as a single match or mismatch. As well, if matching T(2,4) and only 1 T is found, this counts as a single mismatch.
Table of IUPAC Ambiguity Codes
| IUPAC-IUB/GCG Code | Meaning | Complement |
|---|---|---|
| A | A | T |
| C | C | G |
| G | G | C |
| T/U | T | A |
| M | A or C | K |
| R | A or G | Y |
| W | A or T | W |
| S | C or G | S |
| Y | C or T | R |
| K | G or T | M |
| V | A or C or G | B |
| H | A or C or T | D |
| D | A or G or T | H |
| B | C or G or T | V |
| X/N/. | G or A or T or C | X |
GFS Search
How to do a GFS search on a sequence.
You can do a GFS search from the sequence display window Select GFS from the Analysis menu. The following dialog will then appear.

Enter your mass list in the textbox, or click on the Load Mass List File button and select a file that contains the list of masses. When you are ready, click on the OK button to perform the search, or the Cancel button to close the dialog window without performing the search. You may see another dialog window depending on your preferences where you can enter the parameters for the GFS search.
Viewing Sequence Information
How to view information about a sequence.
Brief Sequence Details
How to view the details of the current sequence.
You can view the sequence details from either the sequence listing window or the sequence display window
- Sequence Listing Window
- From the View menu, choose the Virus Info menu item.
- Sequence Display Window
- From the View menu, choose the Virus Info menu item.
The following window will be displayed.
Reading the Sequence Map
How to read the sequence map.
This is a representation of the data mapping that is available within VGO. Here is an explanation of each of the items indicated above, and how to use them.
| Name | Description | Single Click | Double Click | |
|---|---|---|---|---|
| 1 | Sequence Search Results | Maps the locations of sequence search hits. There may be as many searches done on the sequence as you please. | Selects the region covered by the hit and displays information about the hit in the status bar. | Opens a sequence viewer with the sequence represented by the clicked on hit displayed. |
| 2 | Imported Analysis | Shows the location of features returned by some external source and brought as input to VGO. | Selects the region covered by the feature selected. | Opens a sequence viewer with the sequence represented by the feature displayed. |
| 3 | Colorized Gene Analysis | Displays the genes of this genome colored based on particular properties. See the gene analysis page for more information. | Selects the region, displaying pertinant information on the status bar. | Opens a legend describing the meaning of the colors used. |
| 4 | Open Reading Frames | Displays the open reading frames in the 3 frames of the sequence. | Selects the region covered by the selected ORF. | Opens a sequence display showing the sequence for the selected ORF. |
| 5 | Start and Stop codons | Shows the location of all start (green) and stop (red) codons in the sequence. | No Action | No Action |
| 6 | Gene Features | Shows the location of all genes in this sequence. Genes covering more than one open reading frame will be indicated with a connector. Through view settings you may display the gene label as the gene name, the family number for the gene or nothing at all for compactness. | Selects the region indicated by the feature | Opens the Gene Data Window for this gene. |
Top / Bottom Strand DNA
How to view the top or bottom strand DNA sequences.
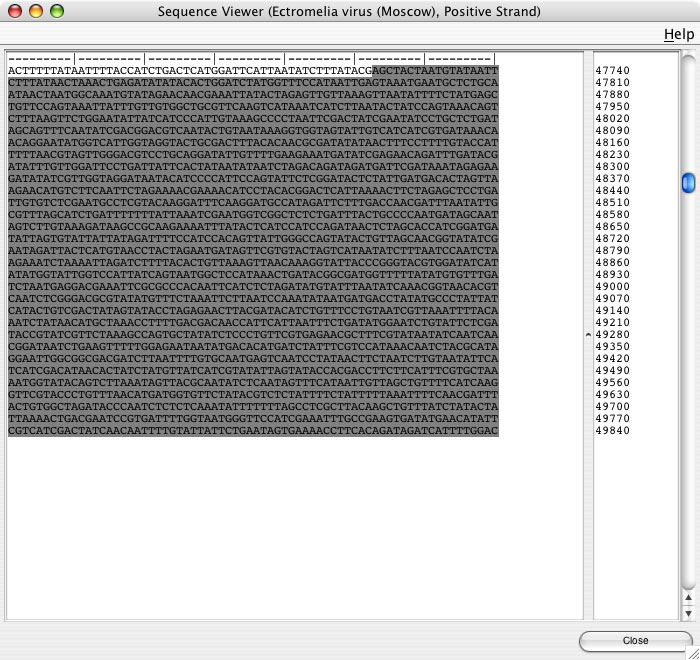
This window displays a numbered, scrollable listing of the entire DNA sequence for the currently selected organism.
This window listens to appropriate selections in the sequence map window. For instance, if you have an organism open in the sequence map window, with the Top Strand DNA window also open, you can see the results of selections made in the sequence map in the DNA window.
This window should be used to view DNA sequences, and relate them to information displayed on the sequence map. To copy sequence data to the clipboard, it is recommended that you use the “Genome Subsequence” facility, from the “View” menu.
Gene Information
How to view information about a gene in VGO.
This window allows for closer analysis of a particular gene. To open this window, double click on a gene in the sequence map window.
In this window, you are able to view:
- The name of this gene as stored in the database
- The multiple alignment of this particular gene’s family through the use of Jalview
- The protein sequence for the gene (This information is selectable and may be used to copy into other applications, such as dotlet or other alignment programs)
- The DNA sequence for the gene by clicking this button
- Details of this gene, such as amino acid frequency, name, etc. by clicking this button
- The most recent Tblastn, Psiblast or Blastp reports generated for this gene by clicking one of these buttons
- The Blast reports for this gene through MView
- The genes contained with in this particular gene’s family by clicking this button