The Genome Map
A physical map of the genome.
To display a genome map select a genome in the “Virus selector” and in the “Draw” menu select “Genome Map“.
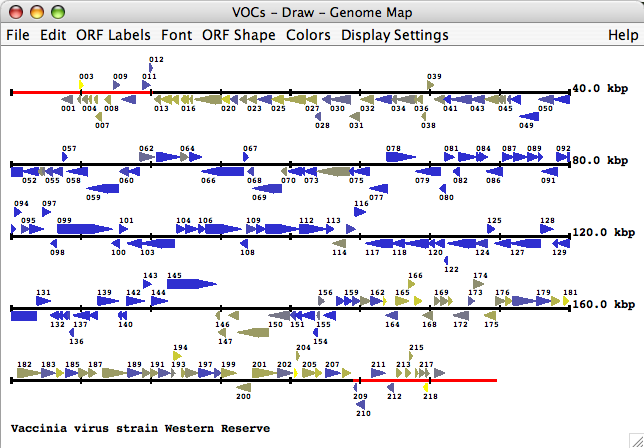
The genome map provides a graphical overview of genes, mature peptides and fragments in the selected genome. All genes of the genome are drawn either as arrows (default) or as rectangles. Each gene is colored by default according to the size of the family that the gene belongs to. Via the preferences menu one can change the coloring of the genes, the shape of the genes, fonts, the gene labels, the footer text, etc. By clicking on a gene in the map, gene, genera and ortholog group information can be displayed and colors can be changed.
By default, the genome map only displays ORF labels for genes that do not overlap.
The Genome Map Menu Bar

The “File” Menu
Use this menu to save the genome map, print it or close the genome map.
The “Edit” Menu
Reset all genome map settings from here.
The “ORF Labels” Menu
Should you wish to change how the gene labels are displayed, from this menu you may apply a label filter, display the ortholog group IDs (family IDs) instead, display every nth gene or turn off the labelling altogether.
The “Font” Menu
Change the size of the font of the labels via this menu. If “Dynamic” is selected, the font size will change proportionally with the size of the window.
The “ORF Shape” Menu
You may display the shape of the genes as lines arrows or rectangular bars using the options in this menu.
The “Colors” Menu
This menu allows you to select colors based on your preferential coloring scheme. Genes can be labelled by:
- ortholog group (“family”) – “color by family assignment” will designate to each gene of an ortholog group a certain color; you may change the color of individual genes by selecting the gene then clicking on “change color” in the box that pops up. Alternatively, you can color the genes according to a pre-defined coloring scheme for the total number of genes in each gene’s ortholog group by selecting “enable coloring by family size”. To change the color of a color group, click on it. All color groups can be deleted and new color groups may be defined.
- genus – this will color genes based on a pre-defined coloring scheme for the total number of genera in the ortholog group of the selected gene; you may change the color of individual genes by selecting the gene then clicking on “change color” in the box that pops up. If you select “enable coloring of a specific genus”, you can choose a specific color that will color every gene belonging to an ortholog group that contains the genus you select.
- strand – if this option is enabled, the genes encoded on the top strand will be displayed as one color and the genes encoded on the bottom strand will be another color.
- gene type – if enabled, this feature will color each gene according to whether it encodes a protein or pseudogene.
- import color info – this will save the color settings to genes as presented on the genome map and allow you reload these saved settings in the future.
To change the way the genes are colored, you must scroll over “enable coloring by [your choice of feature]” and select it. To pick your choice of color for each feature option, click on the option you would like to change (each option should have a colored box next to it). You may also change the color of the ITRs on the solid line representing the entire genome sequence.
The “Display Settings” Menu
This is the menu used to manipulate the way the genome map is displayed in the main window. These settings make it easier to pick out/view features for which you may be looking. From this menu:
- Choose to show/hide proteins, pseudogenes or the color-coding legend
- Toggle with the border width for the genome map
- Define the border width
- Set the number of basepairs per line
- Define the step size to make it easier to see the length of genes
- Change the footer text