Codon Statistics Quick Start
What is it? Codon Statistics (CS) is a java based user interface, which enables one to quickly browse statistical information on one or more genomes. One may view statistical information on both graphical and tabular forms.
How do I get started?
- Select Codon Statistics from the VBRC Tools drop-down menu (top left of page).
- Click the Launch Program button. CS will be downloaded to your computer and Java Web Start will automatically start the program.
- Choose the database of interest from the list that appears.
Click here to go directly to the CS page.
What next? The main CS window shown below will open.
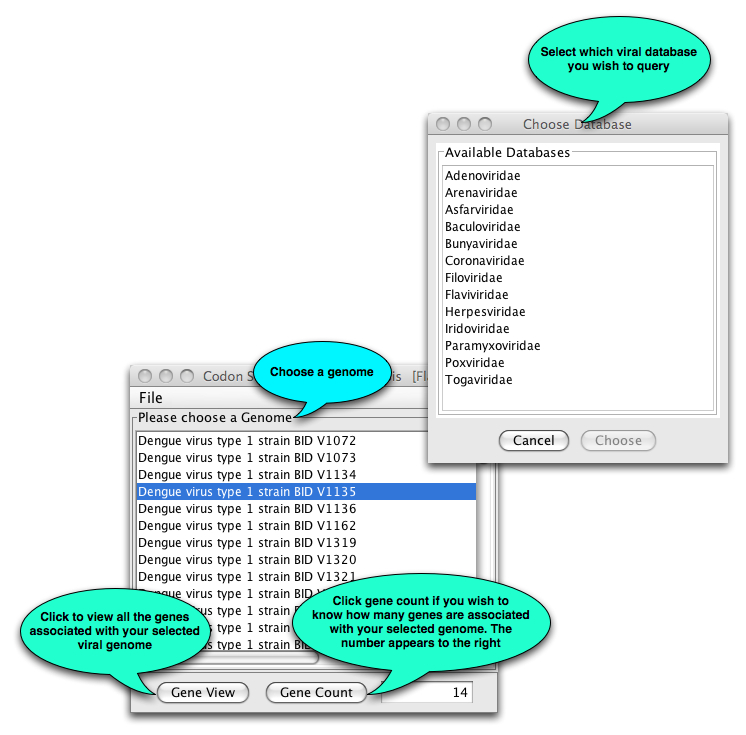
Once you have selected a genome, the following will open:
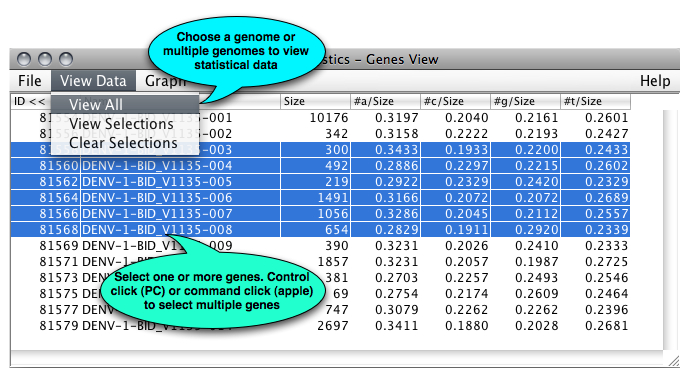
Once you have selected one or more genes, additional information is shown:
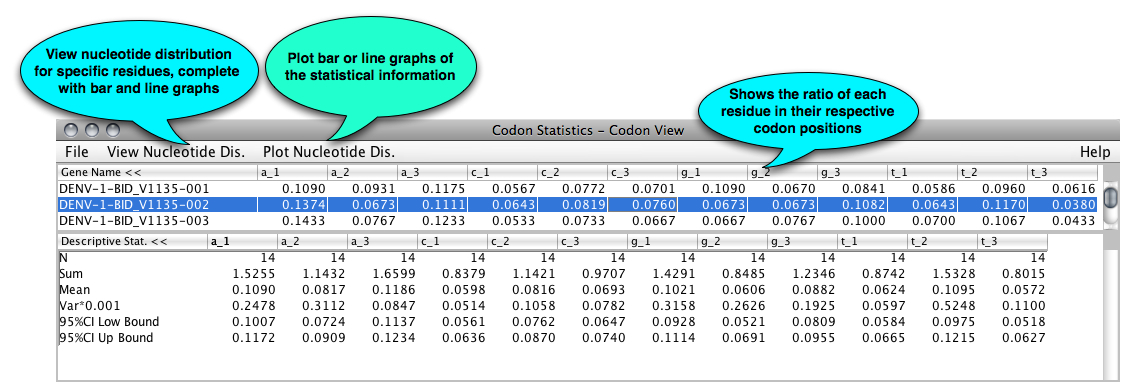
The codon table displays the percentage of each nucleotide in each codon position. a_1 represents the number of a’s occurred in the first position of a codon divided by the length of the gene; similarly to other column. In the bottom of the table, the sum, mean, and the variance are displayed, which are the statistical data of the set of genes.
The mean is calculated by the formula of: Mean = Sum/number of genes selected
The variance is estimated by the formula of: Var = sum of(yi-Mean)^2 /(number of genes -1) Where yi is the ith gene in the table and i from 1 to the number of genes.
95% CI Low Bound = Mean-1.96 sqrt(Var/N)
Up Bound = Mean + 1.96 sqrt(Var/N)
When N>=100, the 95%CI values can be used safely. Otherwise, normality testing is needed before using the data.
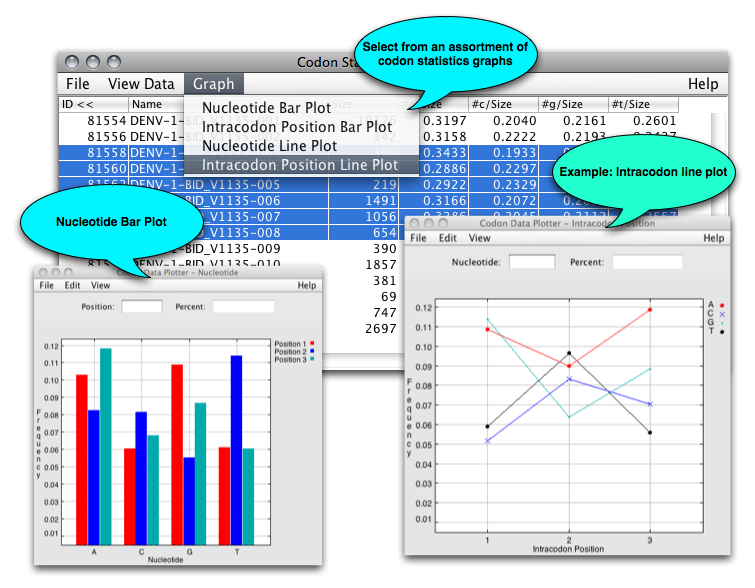
From the Genes View window, users can view line and bar graphs of the relative nucleotide codon compositions: