Genes/ORFs Grouped by Strand
Displays the gene arrangement of a genome
To plot the genes of a genome grouped by strand select one or more genomes using the Virus selector and from the ‘Draw’ menu select ‘Plot Genes/ORFs grouped by strand’.
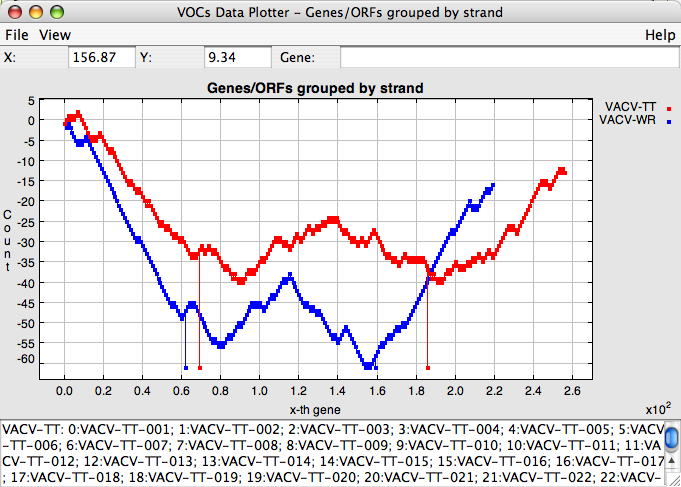
The graph displayed shows how the genes of a genome are grouped according to the strand on which they are located. Point (0,0) is defined as the starting point. Each gene is represented by a line connecting only two points; the line will either have a positive slope or a negative slope. The slope of the line segment will be either 1 or -1 depending on whether the gene is located on the 5′-3′ strand or 3′-5′ strand respectively.
To zoom into a region of interest, click on the graph and drag your mouse until the region of interest is contained within the blue box that appears. Portions of the map can be further magnified by repeating this procedure. To return to the default view (zoom completely out), select “Reset” from the “View” menu. The graph can also be printed or saved as an image using the “File” menu.
This graph can be used to visualize potential patterns in the direction/location of the genes/ORF of a genome. Also, potential patterns in the direction/location of the genes/ORF can be compared within a group of genomes.