The Ortholog Group Map
Displays gene relationships between two genomes.
To display an ortholog group map, select two genomes in the Virus selector and from the “Draw” menu select “Ortholog Group Map“.
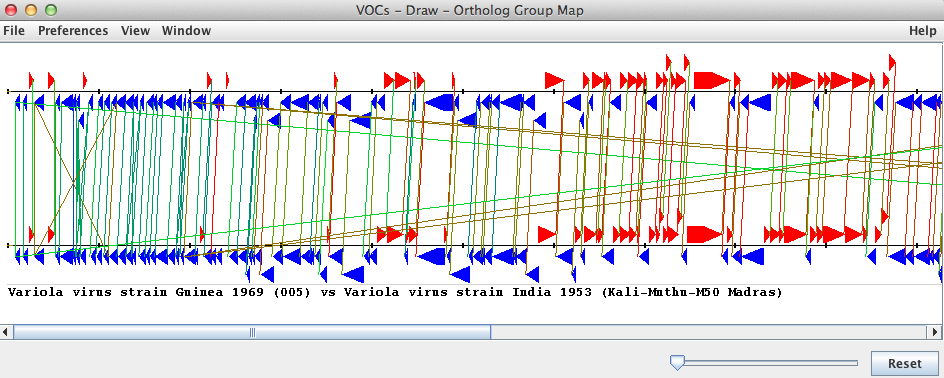
This map provides a graphical overview of the genes (and ortholog groups) of each of the genomes. If the two selected genomes each contain a gene in the same ortholog group, a line will connect the ends of both genes; the line represents the ortholog group the two genes share. The color of each line depends on the size of the ortholog group it represents.
The “File” menu will allow you to save the picture as an image (.jpg format), print the ortholog group map or close the map.
Using the “Preferences” menu, you can change the line state (to show or hide the lines), the coloring of the genes, the shape of the genes, the footer text and the width of the border surrounding the ortholog group map. The color (and state) of an individual line and both corresponding genes can be changed by clicking on the gene belonging to the genome located at the top of the screen.
To make the genes and connecting lines more easily distinguishable, you can stretch the length of the genome by horizontally dragging the slider located in the bottom right hand corner of the main window (to the left of the “reset” button). The “reset” button will bring the slider back to the default position.
The “View“ menu will allow you to access a legend of family colors. Colors correspond to line color (ortholog group) in the map, which depends on the size of the ortholog group.
The “Window“ menu allows switching between open VOCs windows.