The Ortholog Groups Table
The Ortholog Groups Table Main Window
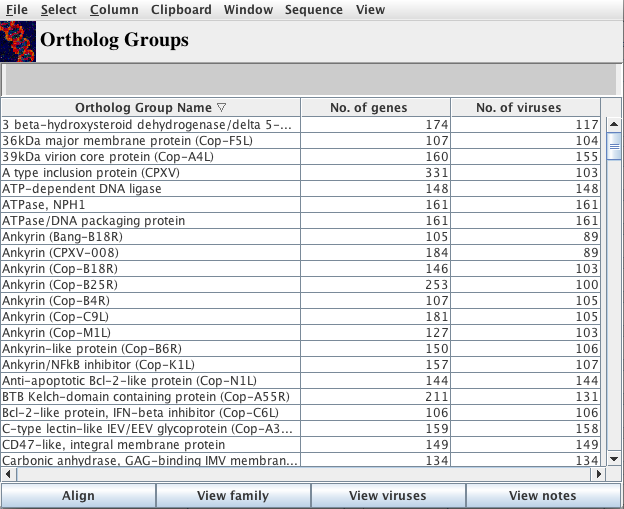
The “Align” button will open a Base-By-Base window in which all viruses in the selected ortholog groups will be aligned. This process may take a while if multiple ortholog groups are selected and/or ortholog groups containing many (100+) viruses are selected.
The “View family” button will open a window displaying all genes contained in the selected ortholog groups.
The “View viruses” button will open a window displaying all genomes with genes contained in the selected ortholog groups.
The “View notes” button will open a window that contains notes (if any) associated with the selected ortholog groups.
The Ortholog Groups Table Menu Bar
![]()
The functions within the menus “File“, “Select“, “Column” and “Clipboard” are common functions to all tables explained in The Tables of VOCs
The “Sequence” Menu
From this portion of the menu, you can conduct searches of all genes within selected ortholog groups, view all sequences of genes within selected ortholog groups as well as save the information. For more information on how to use this feature, go to “The “Sequence” Menu” section of The Gene Results Table documentation.
The “View” Menu
You may view all genomes that are absent from the selected ortholog groups by selecting “View missing viruses“.
The “Analysis” Menu
This menu allows you to graph the relatedness of genes in selected ortholog groups.
The Plot Genes option, will plot a single selected ortholog group and all genes in that ortholog group, with labels for each gene that can be turned on or off by selecting from the list of genes beside the graph. The Plot Ortholog Groups option will plot multiple ortholog groups and all the genes associated with them, but will only show labels for the ortholog groups themselves (not the genes).