VGO How-to Documentation
VGO is a Java-based interface for viewing and searching genomes. It can be used to display information about a genome, including its genes, ORFs, and start/stop codons. It can also be used to perform regular expression, fuzzy motif, LCS, and mass list searches.
Open New Genomes in VGO |
Analysis in VGO |
Viewing Sequence Information in VGO |
Searching in VGO |
Open New Genomes in VGO
To load sequences from the VOCs database into VGO, go to the sequence listing window. VGO can only load sequences from one database at a time; if the correct database is not currently open, select Choose Database from the File menu.
Database Chooser
Select the database that you want, and click the Choose button.
Once you have the correct database selected, go to the File menu, choose Open, then choose Open from VOCs DB. The following dialog window will appear.
Sequence Chooser
Choose the sequences that you want to load (multiple sequences can be selected by holding down the Apple key (Mac) or CTRL (PC)), then click on the OK button.
From a Fasta File
To load sequences from a .fasta file, go to the sequence listing window. Go to the File menu, choose Open, then choose Open from Fasta. Select the file that you want to load, and each sequence will be loaded.
Note: Fasta files do not contain any annotations, only sequence data.
From a GenBank File
To load sequences from a GenBank file, go to the sequence listing window. Go to the File menu, choose Open, then choose Open from GenBank. Select the file that you want to load, and each sequence will be loaded, along with their annotations.
From a Base-by-Base File
To load sequences from a GenBank file, go to the sequence listing window. Go to the File menu, choose Open, then choose Open from BaseByBase. Select the file that you want to load, and each sequence will be loaded, along with any annotations that have previously been added to the file in Base by Base.
Viewing Sequence Information in VGO
Sequence Map Legend
To open the sequence map simply double click on the sequence you wish to view in the home window (sequence listing window). For multiple sequences, select them using the Apple key (Mac) or CTRL Key (PC) and then click the  button.
You can view the sequence details from either the sequence listing window (the original window) or the sequence display window.
- Sequence Listing Window
- From the View menu, choose the Virus Info menu item.
- Sequence Display Window
- From the View menu, choose the Virus Info menu item.
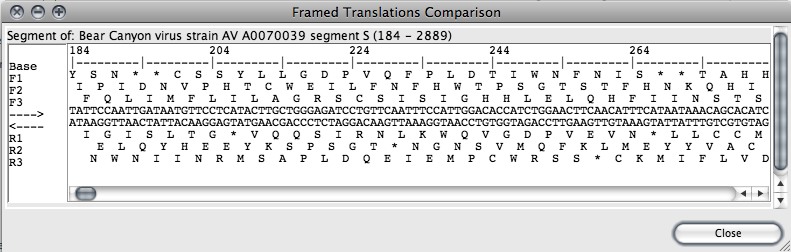
To get a framed translation for one or more sequence segments, select portions of one or more organisms (via the Sequence Map). Then, in the main window, select those organisms you wish to display, then choose “Framed Translation” from the “View” menu.
Note: The framed translator can handle selections of no more than 10kb in length. If a larger selection is attempted, a warning dialog box will be displayed.
The framed translation window displays each amino acid in single letter abbreviated format with stop codons marked with a “*”. The ruler along the top marks each 10 bases in the DNA sequence with a tick, and each 20 bases are marked with their position in the entire sequence for the organism being displayed.
The sequence displayed on the reverse side is the complement of that on the forward strand. Genes occurring on the top are coded from left to right, and on the bottom from right to left.
- The name of this gene as stored in the database
- The multiple alignment of this particular gene’s family through the use of Jalview
- The protein sequence for the gene (This information is selectable and may be used to copy into other applications, such as dotlet or other alignment programs)
- The DNA sequence for the gene by clicking this button
- Details of this gene, such as amino acid frequency, name, etc. by clicking this button
- The most recent Tblastn, Psiblast or Blastp reports generated for this gene by clicking one of these buttons
- The Blast reports for this gene through MView
The following is a list of independent display options for the Sequence Display window. These options may be turned on or off for each individual sequence or for all sequences.
Start/stop codons
ORF with a minimum ORF length option
Bottom strand
Gene Labels
– Gene number
– Family number
– Short Gene number
– GenBank name
Lane Descriptions
GFS
Repeat Regions
BBB Comments
BBB Primers
Searching in VGO
GFS (Genome-based fingerprint scanning)
You can do a regular expression search from the sequence display window; select Reg. Expression Search from the Analysismenu. The following dialog will then appear.
Enter your regular expression in the textbox, and click on the OK button to perform the search, or the Cancel button to close the dialog window without performing the search.
Regular expressions allow one to search for precise patterns which may include optional sections and/or repeated sequences. For detailed help on regular expressions, please see The Perl Regular Expression page for more information.
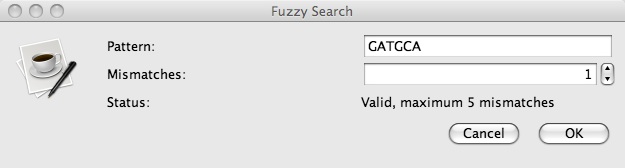
Enter your fuzzy motif in the top textbox and enter the number of mismatches to allow in the lower textbox. Click on the OKbutton to perform the search, or the Cancel button to close the dialog window without performing the search.
The Fuzzy Motif Search allows users to enter in an expression pattern (see below for an explanation of the pattern grammar used) as well as a maximum number of mismatches tolerated in a search hit. VGO then searches marked sequences for this motif and displays the list of hits by location along the sequence. In addition to the ambiguities created by mismatches, users may enter in IUB ambiguity codes, which are also indicated below.
| Fuzzy Expression | What it matches |
|---|---|
| ACT | an A, C, T pattern |
| [ AC ]T | an A or a C followed by a T |
| {AC}T | Everything but an A or a C followed by a T |
| ACT{1,3} | An A, then C followed by 1, 2 or 3 T’s |
Note: When counting mismatches, [] and {} count as a single match or mismatch. As well, if matching T(2,4) and only 1 T is found, this counts as a single mismatch.
Enter your mass list in the textbox labeled Mass List, or click on the Load Mass List File button and select a file that contains the list of masses. When you are ready, click on the OK button to perform the search, or the Cancel button to close the dialog window without performing the search. You may see another dialog window depending on your preferences where you can enter the parameters for the GFS search.
Analysis in VGO
- Base Composition
- This colors genes based on the percentage of one or more nucleotide bases that they contain.
- Amino Acid Composition
- This colors genes based on the percentage of one or more amino acids that they contain.
- Family Representation
- This maps the virus frequency of each gene in the displayed genome. This is to say, it maps based on the number of viruses represented in the particular gene’s family.
>Analysis 1 name start|stop|strand|description|color start|stop|strand|description|color … >Analysis 2 name … etc. |
| >First VGO Import Analysis Example 100|400|POSITIVE|region 1|2F4F4F 500|600|NEGATIVE|region 2|2E8B57 >Second VGO Import Analysis Example 400|500|POSITIVE|region 3|A52A2A 600|700|NEGATIVE|region 4|A52A2 |
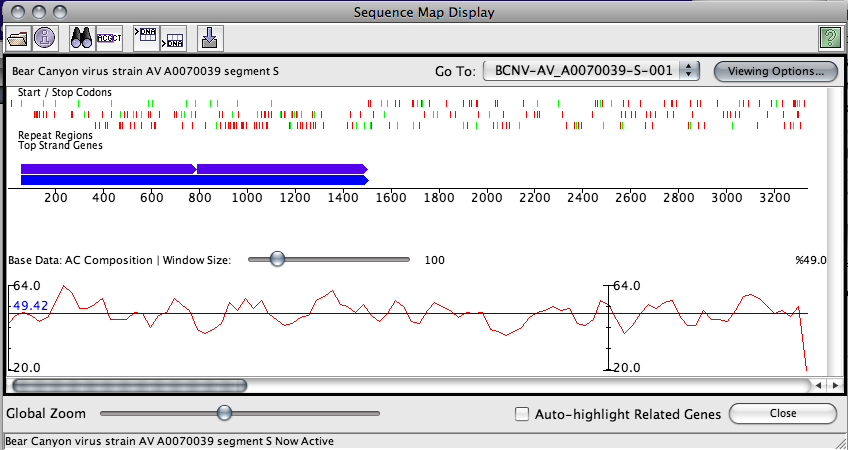
This graph panel will appear at the bottom of the sequence map and display the following information:
- A plot line in red. This plots the data long the sequence at the scale currently displayed in the map window
- A description of the data being plotted
- The sampling window size, which is customizable through the use of a slider
- The minimum percent composition along the entire genome (Y-axis minimum)
- The maximum percent composition along the entire genome (Y-axis maximum)
- The mean percent composition along the currently viewable portion of sequence. This is displayed in blue.
Graph calculations are done using a sliding window scale, sampled at regular fractions of the window size. By default, the fraction of the window size used to sample the data is 1/3. This means that with a window size of 60, data will be sampled every 20 bases. In addition, the information displayed at every 20th base will be the average from that position forward to the end of the window. For performance reasons, only the data currently displayed on the screen will be sampled. A side effect of this is that the the shape of the graph may appear to change as you scroll left or right through the map display.